
GEO and AI search
Measuring GEO visibility means two things in practice: testing regularly whether AI services mention your company in buying-intent questions, and tracking from analytics how much traffic and business comes from AI sources. Neither is enough on its own. Without question tests you do not know your visibility; without analytics you do not know its value. Here is a workable measurement model you can set up without special tools.
Build a question bank — the foundation of measurement
Everything starts with a list of 15 to 30 questions representing your customers’ buying journey. Three kinds of question:
- Recommendation questions: ”what is a good [service] in [city]”, ”best [product] for an SME”, ”who should I buy [X] from”
- Comparison questions: ”[you] or [competitor]”, ”[solution A] or [solution B]”
- Brand questions: ”what is [your company]”, ”is [your company] reliable”, ”[your company] reviews”
The questions are best written the way a real customer would ask them: conversationally and in whole sentences, not as keywords. Keep the list fixed from month to month, otherwise the results are not comparable.
Run the tests and score the results
Run the question bank monthly on at least two services. A sensible minimum is ChatGPT and Perplexity; a broader set adds Gemini and Google’s AI answers. Record four things from each answer:
| What to record | Why |
|---|---|
| Is the company mentioned (yes/no) | the main metric: share of questions with a mention |
| Position in the answer (1st, 2nd, 3rd …) | the first name carries the weight of the recommendation |
| Tone and errors | wrong information is more urgent to fix than a missing mention |
| Which competitors are named and which sources are cited | tells you which listings and content you need to reach |
Two numbers emerge from the results: share of mentions (in how many of the 30 questions you were named) and share of voice against competitors. These are GEO’s equivalent of search rankings.
One caveat: language model answers vary from run to run. The same question can produce different mentions on consecutive attempts. A trend across three months is therefore reliable while a single month-on-month comparison is not. A larger number of questions smooths out the randomness.
Four questions and you know what is holding growth back
The growth diagnosis tells you in a minute whether the bottleneck is visibility, the site or measurement.
Connect the analytics
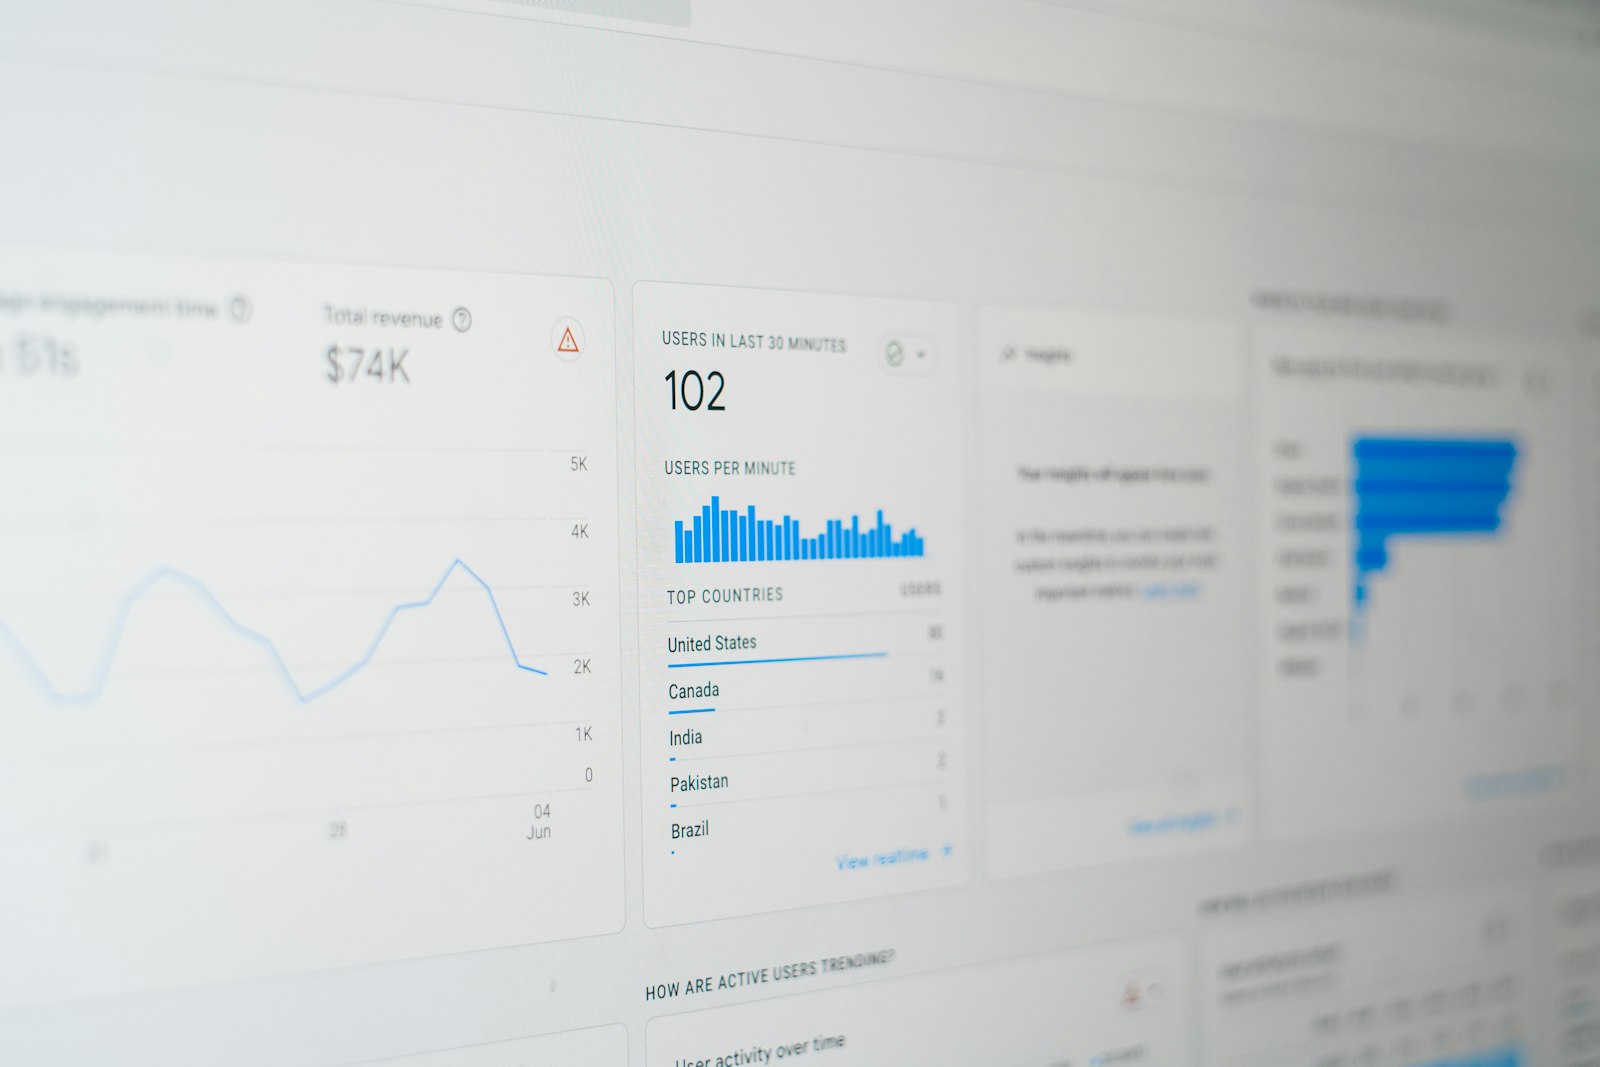
The other half of measurement is GA4: gather the AI sources (chatgpt.com, perplexity.ai, gemini.google.com, copilot.microsoft.com) into a channel of their own and follow sessions, landing pages and conversions. We have written a separate guide on this: measuring AI traffic in GA4.
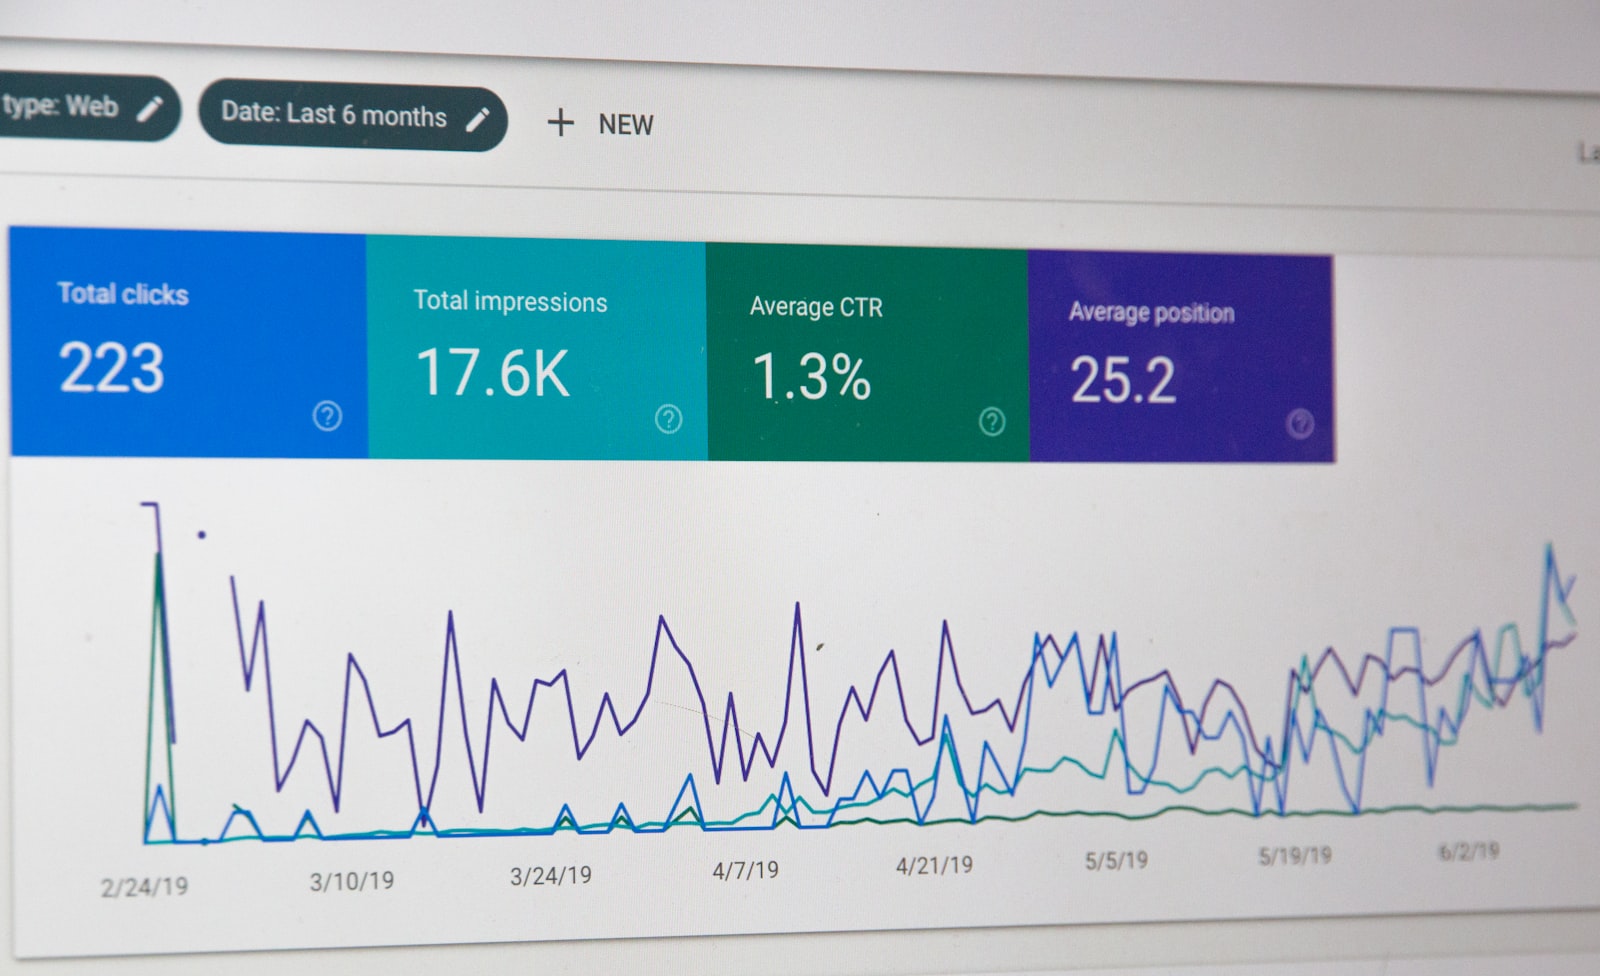
Remember the blind spot in analytics: most of the value of AI visibility does not arrive as clicks but as mentions that lead to a brand search or a direct enquiry later. An indirect checkpoint is the volume of brand searches in Search Console. If mentions grow, over time more people search for your company name.
Report three numbers, not thirty
A workable monthly GEO report fits on one screen:
- Share of mentions: in how many test questions the company was named (for example 8/30 → 11/30)
- AI traffic and its conversions: the figures from the AI channel in GA4
- Findings to fix: incorrect information in answers and new sources you need to reach
Everything else — the wording of individual answers, day-level swings, differences between services — is raw material for the work list, not for the report.

Three layers of measurement, in order of reliability
Measuring AI visibility gets confusing because the available numbers describe different things. Separating them into layers makes the picture usable.
The bottom layer is access. Server logs show which AI crawlers fetched which pages and what response they got. This is the most reliable data you have, because it is a record of events rather than an estimate. It answers one question: can the services read your site at all.
The middle layer is presence. This is where your company appears in answers, and it is measured by asking questions and writing down what comes back. The data is manual and noisy, but it is the only layer that shows whether the reading turned into a mention.
The top layer is outcome. Referral sessions, their conversions, and the volume of brand searches. This is the layer the business cares about, and also the smallest and slowest to move.
Skipping the bottom layer is the common mistake. If crawlers are blocked, nothing above it can improve regardless of how much content you write.
Build a question set once and keep it
The measurement stands or falls on the questions. Assemble twenty of them and use the same twenty every time.
Take five from the top of the buying journey, phrased the way someone would ask before they know the vocabulary. Take five comparison questions, of the kind asked when two options are on the table. Take five that name your service and location together. Take five about your own company by name, which reveal what the services believe about you.
The reason to freeze the set is comparability. A question added in month three has no history, and a set that drifts produces a trend line that measures the questions rather than your visibility. Add questions only at year boundaries, and keep the old ones running alongside.
What to record for each answer
Keep the record short enough that you will still do it in six months. Five columns are enough.
- Date and service. Answers change over time and differ between services, so both need to be on the row.
- Mentioned or not. A yes or no for whether your company appears.
- Cited or not. Whether your site is listed as a source, which is a stronger signal than a mention.
- Position in the answer. First, middle or last. Being named first is worth far more than being named at all.
- Competitors present. The names that appear alongside you, which over months shows who the services treat as your peer group.
A spreadsheet handles this. Tools exist that automate the questioning, and they are worth their price only once you are running the process reliably by hand.
Reading the numbers without fooling yourself
Two properties of this data trip people up, and both are worth knowing before the first report.
Answers vary between runs. The same question asked twice on the same day can produce different sources, because the underlying search runs afresh each time. A single result therefore proves nothing in either direction, and a share across twenty questions is the smallest unit worth reporting.
Movement is slow. Content published this month may not show in answers for weeks, and training-based knowledge lags by longer still. Comparing month to month mostly measures noise. Comparing quarter to quarter measures something real, which is why the discipline of keeping the same questions pays off only after the third round.
Connecting visibility to money
At some point someone asks what the work returned, and the honest answer needs two numbers rather than one.
The direct number is referral traffic and its conversions. Sessions from AI services are few but tend to convert better than average, because the visitor arrives having already read a description of you. Track the conversion rate separately rather than folding it into an overall figure, where the small volume disappears.
The indirect number is brand search volume. When a service recommends you, many people do not click. They search your name afterwards, and that lands in Search Console as branded organic traffic. A rising brand search trend alongside rising mentions is the clearest evidence available that the visibility is working, even though no analytics tool will draw the line between them for you.
A reporting rhythm that survives a busy year
Monthly is too often and yearly is too rare. Quarterly fits the pace at which this actually moves.
Each quarter, run the twenty questions across two services, update the log, and write four sentences: mention share now versus last quarter, which competitors gained or lost, what changed on the site in between, and what to do next. Half a day of work, four times a year.
Between quarters, watch only the bottom layer. If crawlers stop fetching or start receiving errors, that is worth knowing immediately rather than three months later.
Frequently asked questions
How is GEO visibility measured?
By running a fixed list of buying-intent questions monthly across AI services and recording the mentions, and by tracking traffic from AI sources in analytics. The main metrics are share of mentions and conversions from the AI channel.
Are there tools for GEO measurement?
There is a growing set of commercial monitoring services, but for an SME a manual monthly test in a spreadsheet goes a long way. More important than the tool is a fixed question list and regularity.
Why do AI answers vary between runs?
Language models are not deterministic, and search-based answers also shift as the sources change. A single run therefore says little; a reliable picture comes from a larger set of questions and a trend across several months.
What is a good share of mentions?
It depends on the competition, but direction matters more than level. Starting from zero, a realistic first goal is to be mentioned accurately in your own brand questions and in a couple of recommendation questions within three months.
How often should AI visibility be measured?
Quarterly for the question set, because month-to-month differences are mostly random variation rather than real movement. Crawler access in the server log is worth watching more often, since a block there stops everything above it.
Why do I get a different answer to the same question on different days?
Most services run a fresh search for each question, so the sources vary between runs. This is why a share measured across twenty questions is reportable and a single answer is not.
Our GEO work includes setting up this measurement model and running the monthly monitoring. See the whole thing on the service page. For a single quick measurement, run the AI visibility test.
Related articles

GEO and AI search
Bing visibility matters again — AI search draws on its index
Bing visibility became relevant again after years of quiet, because several AI services rely on Bing’s index for their web searches. A site that…
8 min

GEO and AI search
Local visibility in AI search — four actions that cover most of the benefit
Local visibility in AI search is decided largely by the same ingredients as Google Maps visibility: the Google Business Profile, reviews and consistent basic…
9 min

GEO and AI search
GEO for B2B — the AI writes the buyer shortlist, are you on it
For a B2B company GEO is an unusually strong lever, because AI search hits exactly the stage of the buying journey where B2B deals…
9 min
Get in touch
Shall we take the first step together?
Tell us briefly where you stand. We reply the same working day, usually within a couple of hours.
- A free 30-minute call, no strings attached
- You get a concrete view of where you stand
- We say plainly if we are not the right fit
- Phone+358 50 469 0039
- Emailmisa@purodigital.fi